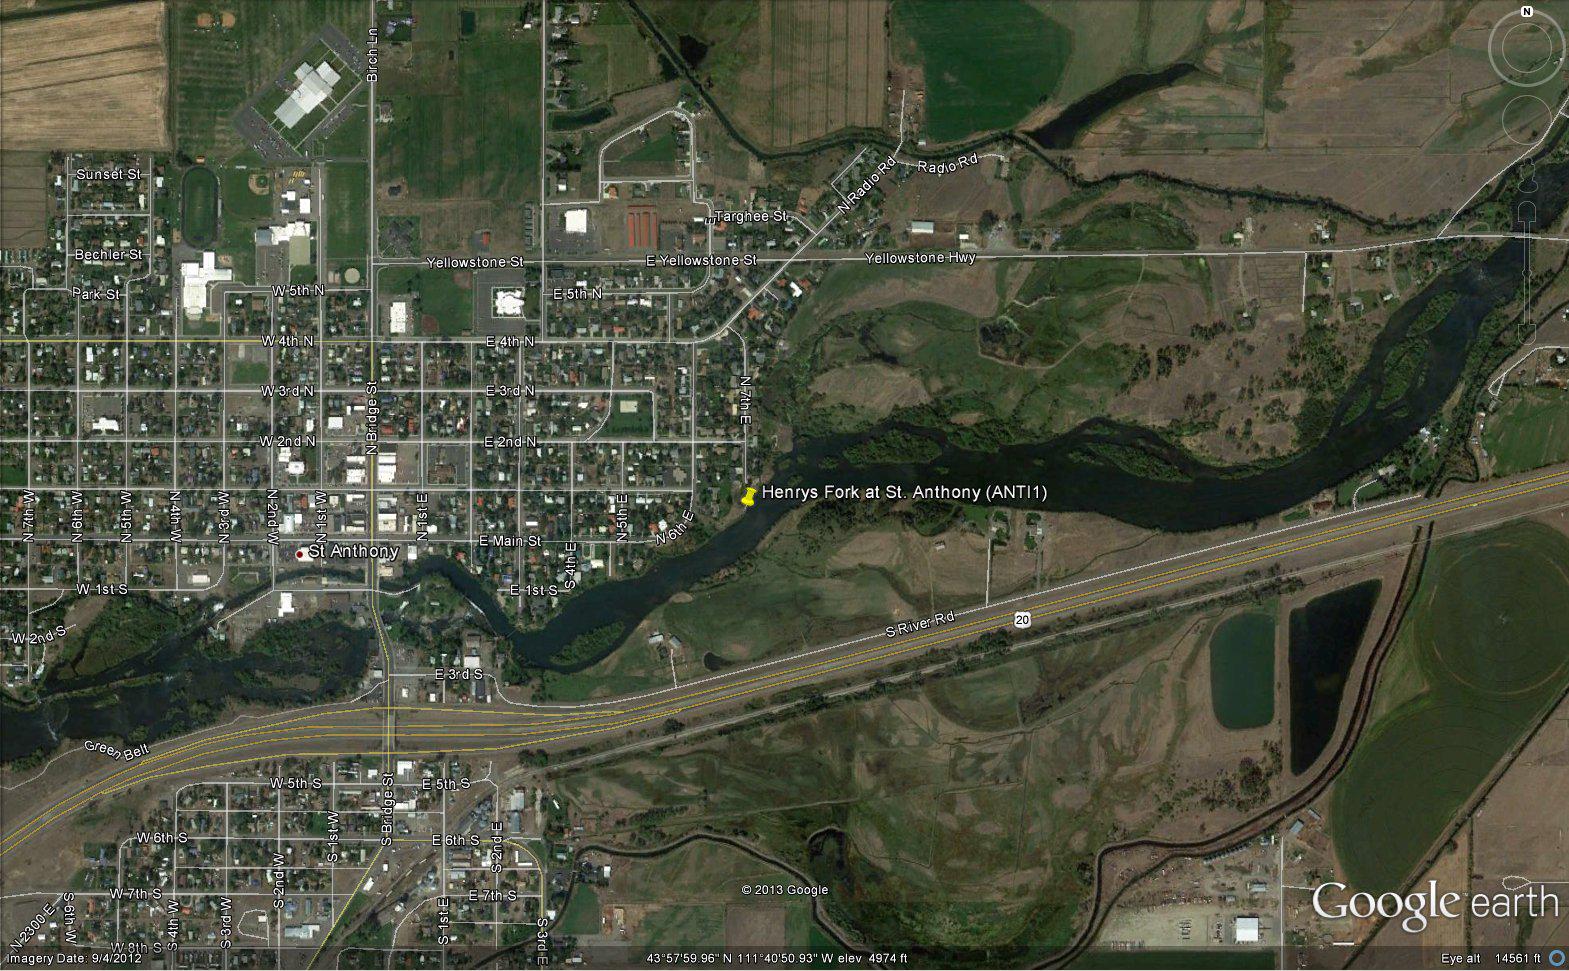
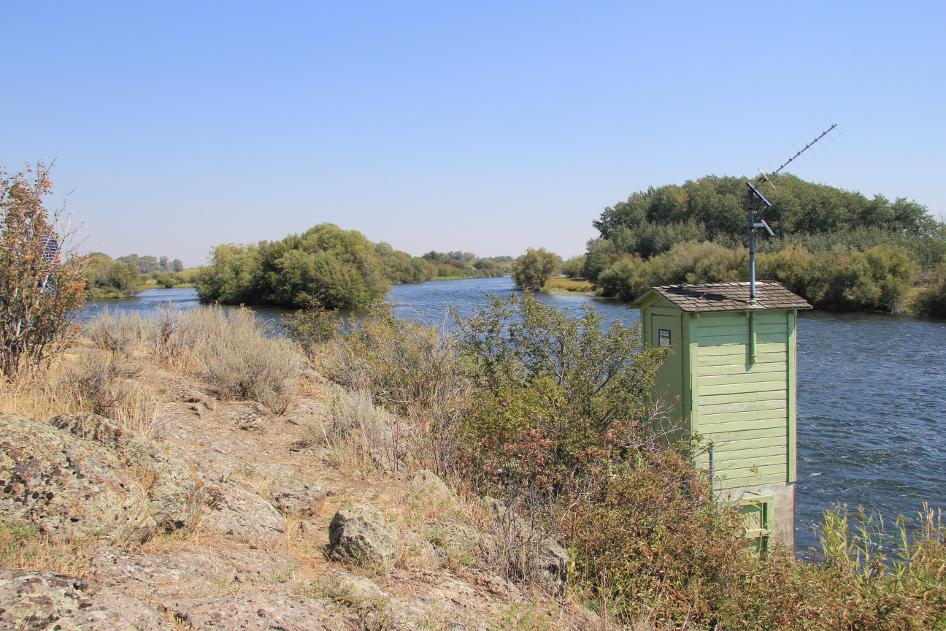
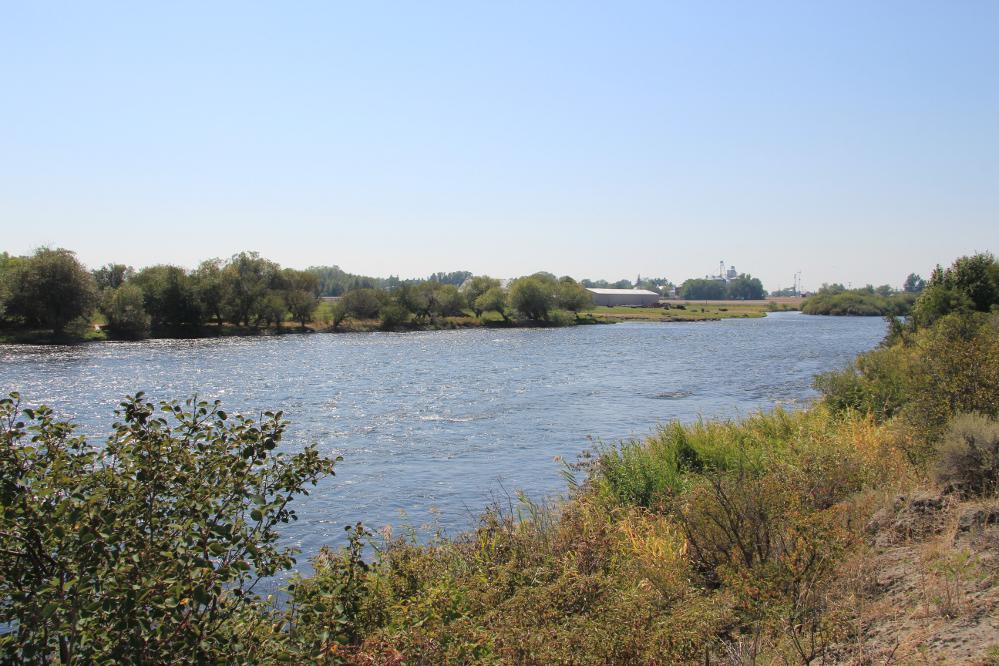
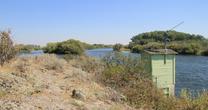
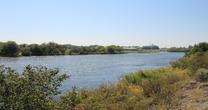
Henrys Fork at St Anthony
Future / Actual / Minor
OWP 2.0 WWA Modal Title
01/11/2021, 10:04 PM UTC through 01/11/2021, 10:04 PM UTC
Sender
Sent
- Warning: no valid ratings curve available. Transformations to and from FEET/CFS/KCFS will not happen.
Traces and Thresholds Click to turn on/off display
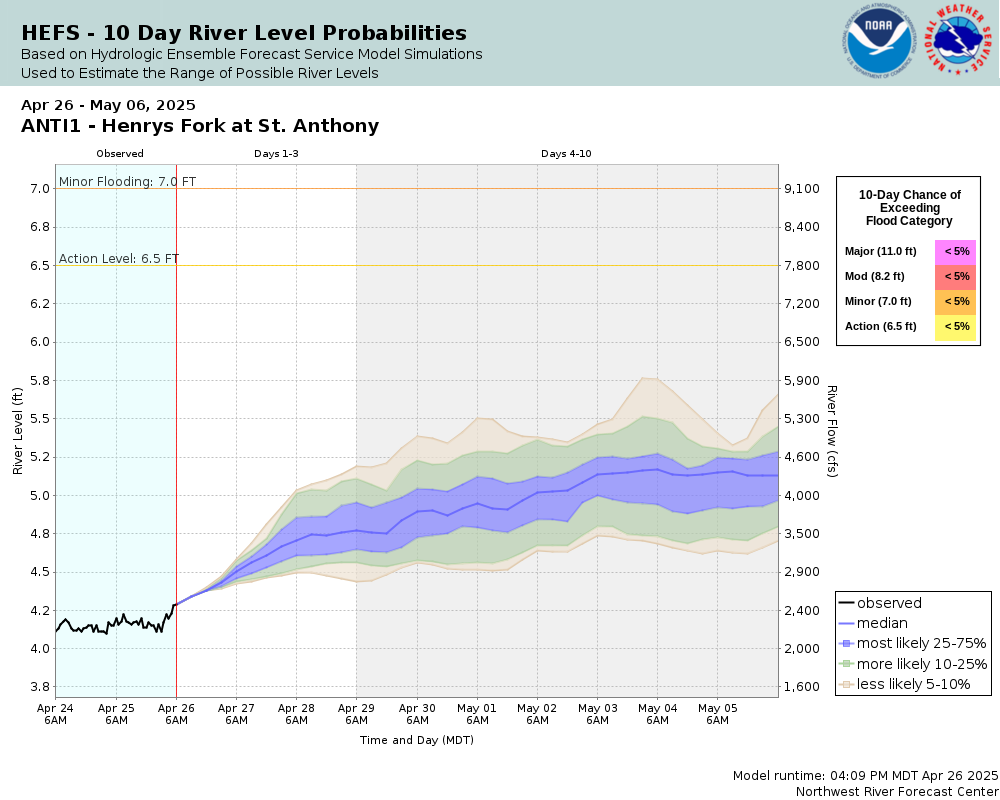
Observed (OBS) 04/14/2025 5:45 AM MDTOfficial Forecast (FCST) 04/13/2025 4:06 PM MDTCATEGORY STAGE 
Major Flooding 11 ft Moderate Flooding 8.2 ft Minor Flooding 7 ft Action 6.5 ft Reliability of the Forecast:
NOTE: Forecasts are issued routinely year-round.
Stage may be affected by ice during winter months.
National Water Model Hydrograph
Official NWS streamflow forecasts are produced by NWS hydrologic forecasters for river gauge locations using hydrologic models which are calibrated to that location. This process considers additional guidance and information, including local expertise and experience, to produce the best forecast possible. The NWM output provides supplemental guidance to NWS forecasters and should not be considered an official NWS river forecast.
Flood Impacts
- 11 - Extensive flooding and road closures.
- 9 - Flooding near homes across from Keefer Island in St. Anthony.
- 8.5 - Water will impact some county roads. Major flooding of farmland will occur. Flooding over South River Road near St. Anthony. Flood waters will flow over Keefer Island in St. Anthony.
Gauge Info
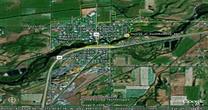
| Coordinates | 43.9668, -111.673 |
| RFC | NWRFC |
| State | ID |
| WFO | PIH |
| County | Fremont |
| Data Provider(s) | |
| US Geological Survey | USGS--Water Resources of the United States |
| USGS | 13050500 |
Gauge Location
Recent Crests
| 1. | 5.80 ft | on 06-14-2022 |
| 2. | 4.96 ft | on 05-01-2021 |
| 3. | 5.67 ft | on 04-30-2020 |
| 4. | 5.85 ft | on 05-17-2019 |
| 5. | 6.09 ft | on 04-28-2018 |
Recent Crests
| 1. | 5.80 ft | on 06-14-2022 |
| 2. | 4.96 ft | on 05-01-2021 |
| 3. | 5.67 ft | on 04-30-2020 |
| 4. | 5.85 ft | on 05-17-2019 |
| 5. | 6.09 ft | on 04-28-2018 |
| 6. | 5.75 ft | on 05-10-2017 |
| 7. | 5.20 ft | on 04-24-2016 |
| 8. | 4.77 ft | on 05-17-2015 |
| 9. | 5.34 ft | on 05-05-2014 |
| 10. | 4.93 ft | on 05-14-2013 |
| 11. | 5.96 ft | on 04-27-2012 |
| 12. | 8.84 ft | on 06-08-2011 |
| 13. | 7.19 ft | on 06-08-2010 |
| 14. | 5.59 ft | on 05-08-2009 |
| 15. | 6.69 ft | on 05-19-2008 |
| 16. | 5.11 ft | on 04-30-2007 |
| 17. | 6.51 ft | on 05-08-2006 |
| 18. | 5.49 ft | on 05-22-2005 |
| 19. | 5.61 ft | on 05-26-2000 |
| 20. | 7.38 ft | on 06-03-1999 |
| 21. | 6.44 ft | on 05-07-1998 |
| 22. | 7.57 ft | on 05-30-1997 |
| 23. | 7.49 ft | on 05-17-1996 |
| 24. | 6.90 ft | on 05-12-1995 |
| 25. | 6.86 ft | on 05-15-1993 |
| 26. | 6.27 ft | on 05-18-1991 |
| 27. | 6.43 ft | on 05-04-1986 |
| 28. | 6.67 ft | on 05-04-1985 |
| 29. | 8.62 ft | on 05-16-1984 |
| 30. | 7.25 ft | on 05-26-1983 |
| 31. | 7.15 ft | on 05-19-1982 |
| 32. | 7.32 ft | on 06-09-1981 |
| 33. | 7.25 ft | on 05-19-1976 |
| 34. | 7.77 ft | on 06-04-1975 |
| 35. | 7.09 ft | on 06-06-1974 |
| 36. | 7.07 ft | on 05-13-1971 |
| 37. | 7.32 ft | on 05-28-1970 |
Historic Crests
| 1. | 8.84 ft | on 06-08-2011 |
| 2. | 8.62 ft | on 05-16-1984 |
| 3. | 7.77 ft | on 06-04-1975 |
| 4. | 7.57 ft | on 05-30-1997 |
| 5. | 7.49 ft | on 05-17-1996 |
Historic Crests
| 1. | 8.84 ft | on 06-08-2011 |
| 2. | 8.62 ft | on 05-16-1984 |
| 3. | 7.77 ft | on 06-04-1975 |
| 4. | 7.57 ft | on 05-30-1997 |
| 5. | 7.49 ft | on 05-17-1996 |
| 6. | 7.38 ft | on 06-03-1999 |
| 7. | 7.32 ft | on 06-09-1981 |
| 8. | 7.32 ft | on 05-28-1970 |
| 9. | 7.25 ft | on 05-19-1976 |
| 10. | 7.25 ft | on 05-26-1983 |
| 11. | 7.19 ft | on 06-08-2010 |
| 12. | 7.15 ft | on 05-19-1982 |
| 13. | 7.09 ft | on 06-06-1974 |
| 14. | 7.07 ft | on 05-13-1971 |
| 15. | 6.90 ft | on 05-12-1995 |
| 16. | 6.86 ft | on 05-15-1993 |
| 17. | 6.69 ft | on 05-19-2008 |
| 18. | 6.67 ft | on 05-04-1985 |
| 19. | 6.51 ft | on 05-08-2006 |
| 20. | 6.44 ft | on 05-07-1998 |
| 21. | 6.43 ft | on 05-04-1986 |
| 22. | 6.27 ft | on 05-18-1991 |
| 23. | 6.09 ft | on 04-28-2018 |
| 24. | 5.96 ft | on 04-27-2012 |
| 25. | 5.85 ft | on 05-17-2019 |
| 26. | 5.80 ft | on 06-14-2022 |
| 27. | 5.75 ft | on 05-10-2017 |
| 28. | 5.67 ft | on 04-30-2020 |
| 29. | 5.61 ft | on 05-26-2000 |
| 30. | 5.59 ft | on 05-08-2009 |
| 31. | 5.49 ft | on 05-22-2005 |
| 32. | 5.34 ft | on 05-05-2014 |
| 33. | 5.20 ft | on 04-24-2016 |
| 34. | 5.11 ft | on 04-30-2007 |
| 35. | 4.96 ft | on 05-01-2021 |
| 36. | 4.93 ft | on 05-14-2013 |
| 37. | 4.77 ft | on 05-17-2015 |
Vertical Datum Table
| type | NGVD29 |
|---|---|
| major Flooding | 4961.70 ft |
| moderate Flooding | 4958.90 ft |
| minor Flooding | 4957.70 ft |
| action | 4957.20 ft |
| Latest Value | 4954.75 ft |
| Gauge Zero | 4950.70 ft |


Unique Local Info
Historical Peak Flows     (Scroll to Streamflow Statistics for more years)
USGS Historical Peak Flows Explanation
Graphical View of Historical Peak Flows and Gage AnalysisÂ
25 Â Â Year Peak Flood 10600 CFS or 7.59 ft
50 Â Year Peak Flood 11600 CFS or 7.96 ft
100 Year Peak Flood 12500 CFS or 8.30 ft
200 Year Peak Flood 13300 CFS or 8.59 ft
500 Year Peak Flood 14300 CFS or 8.96 ft
Collaborative Agencies
The National Weather Service prepares its forecasts and other services in collaboration with agencies like the US Geological Survey, US Bureau of Reclamation, US Army Corps of Engineers, Natural Resource Conservation Service, National Park Service, ALERT Users Group, Bureau of Indian Affairs, and many state and local emergency managers across the country. For details, please click here.