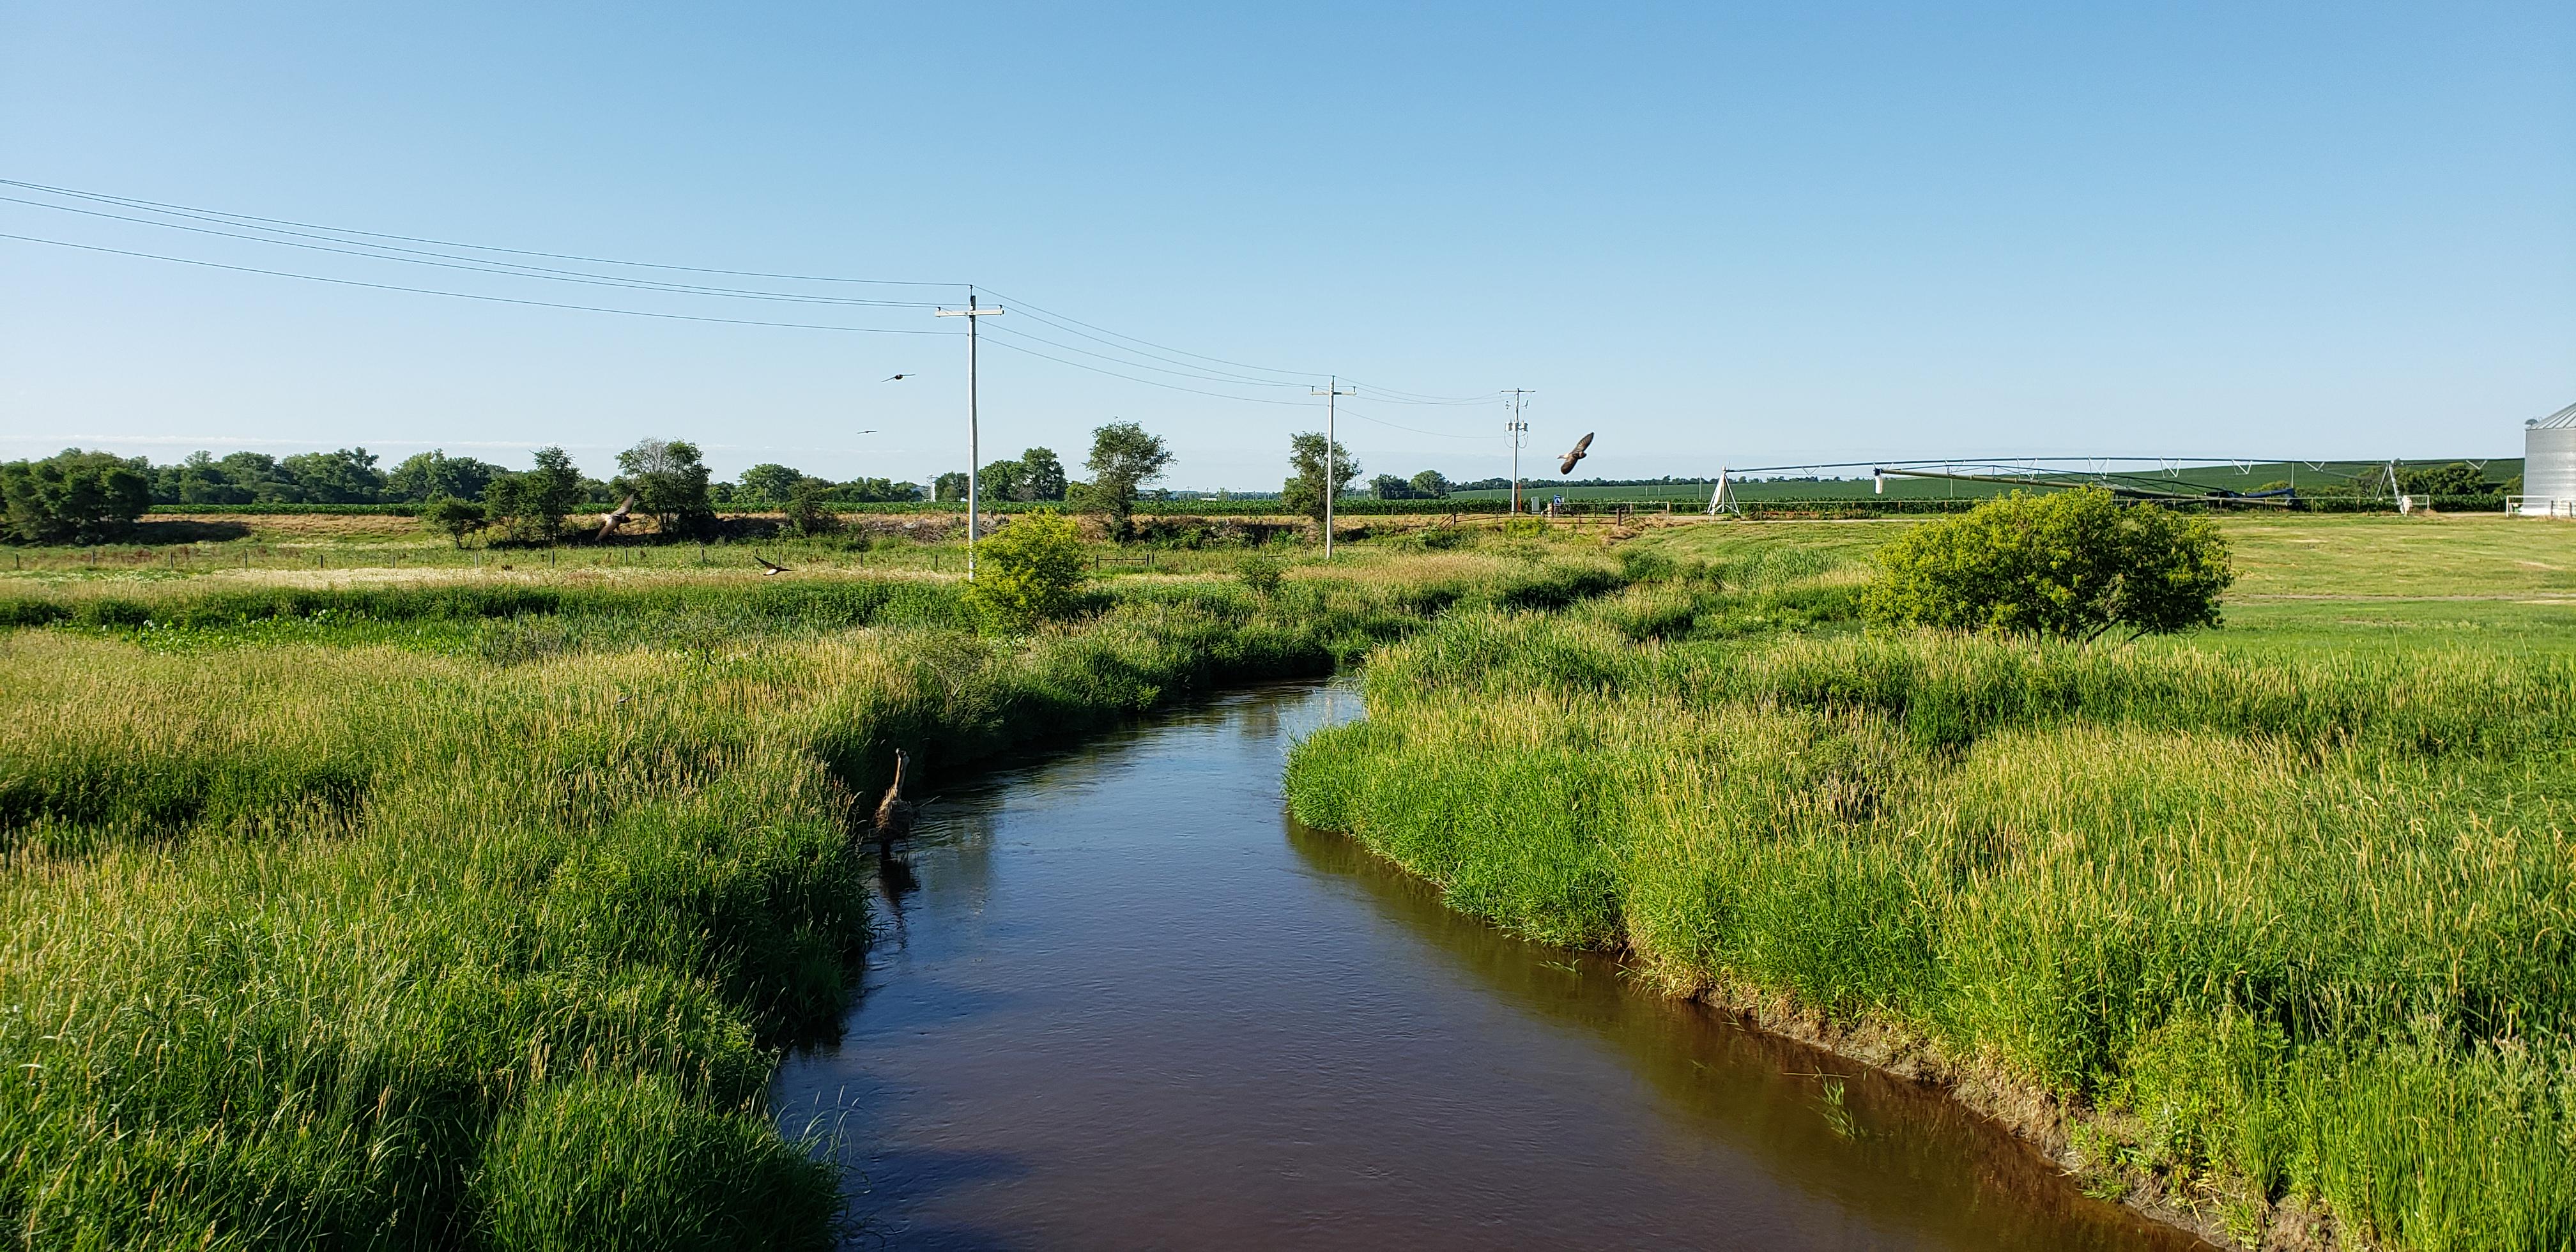
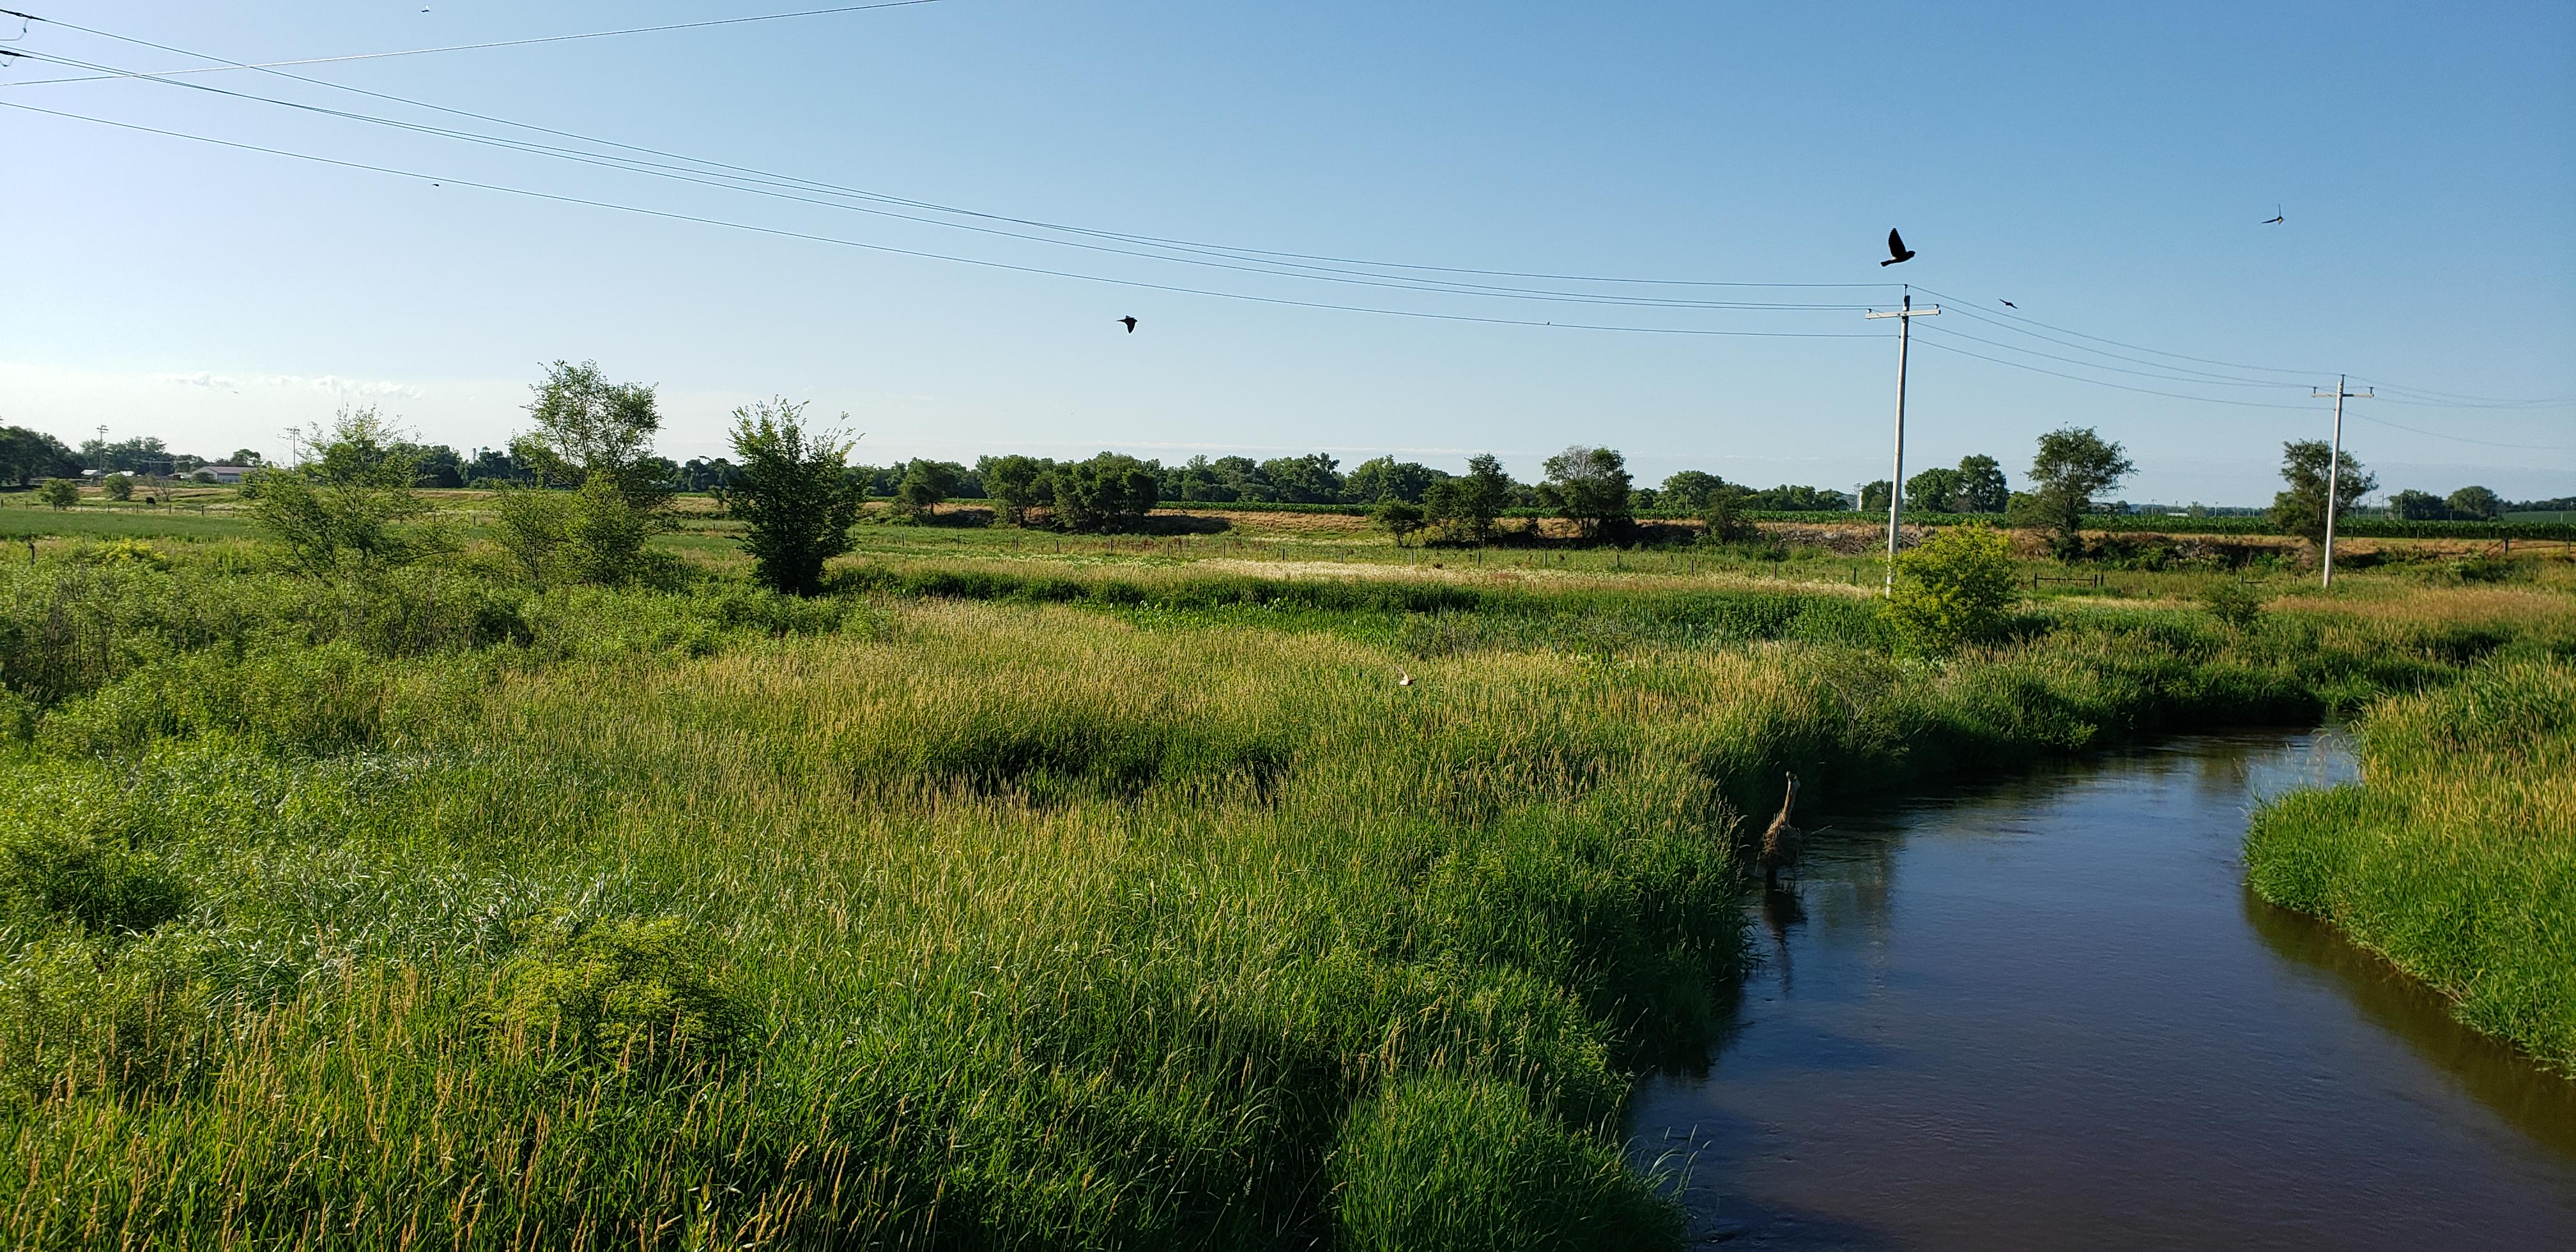
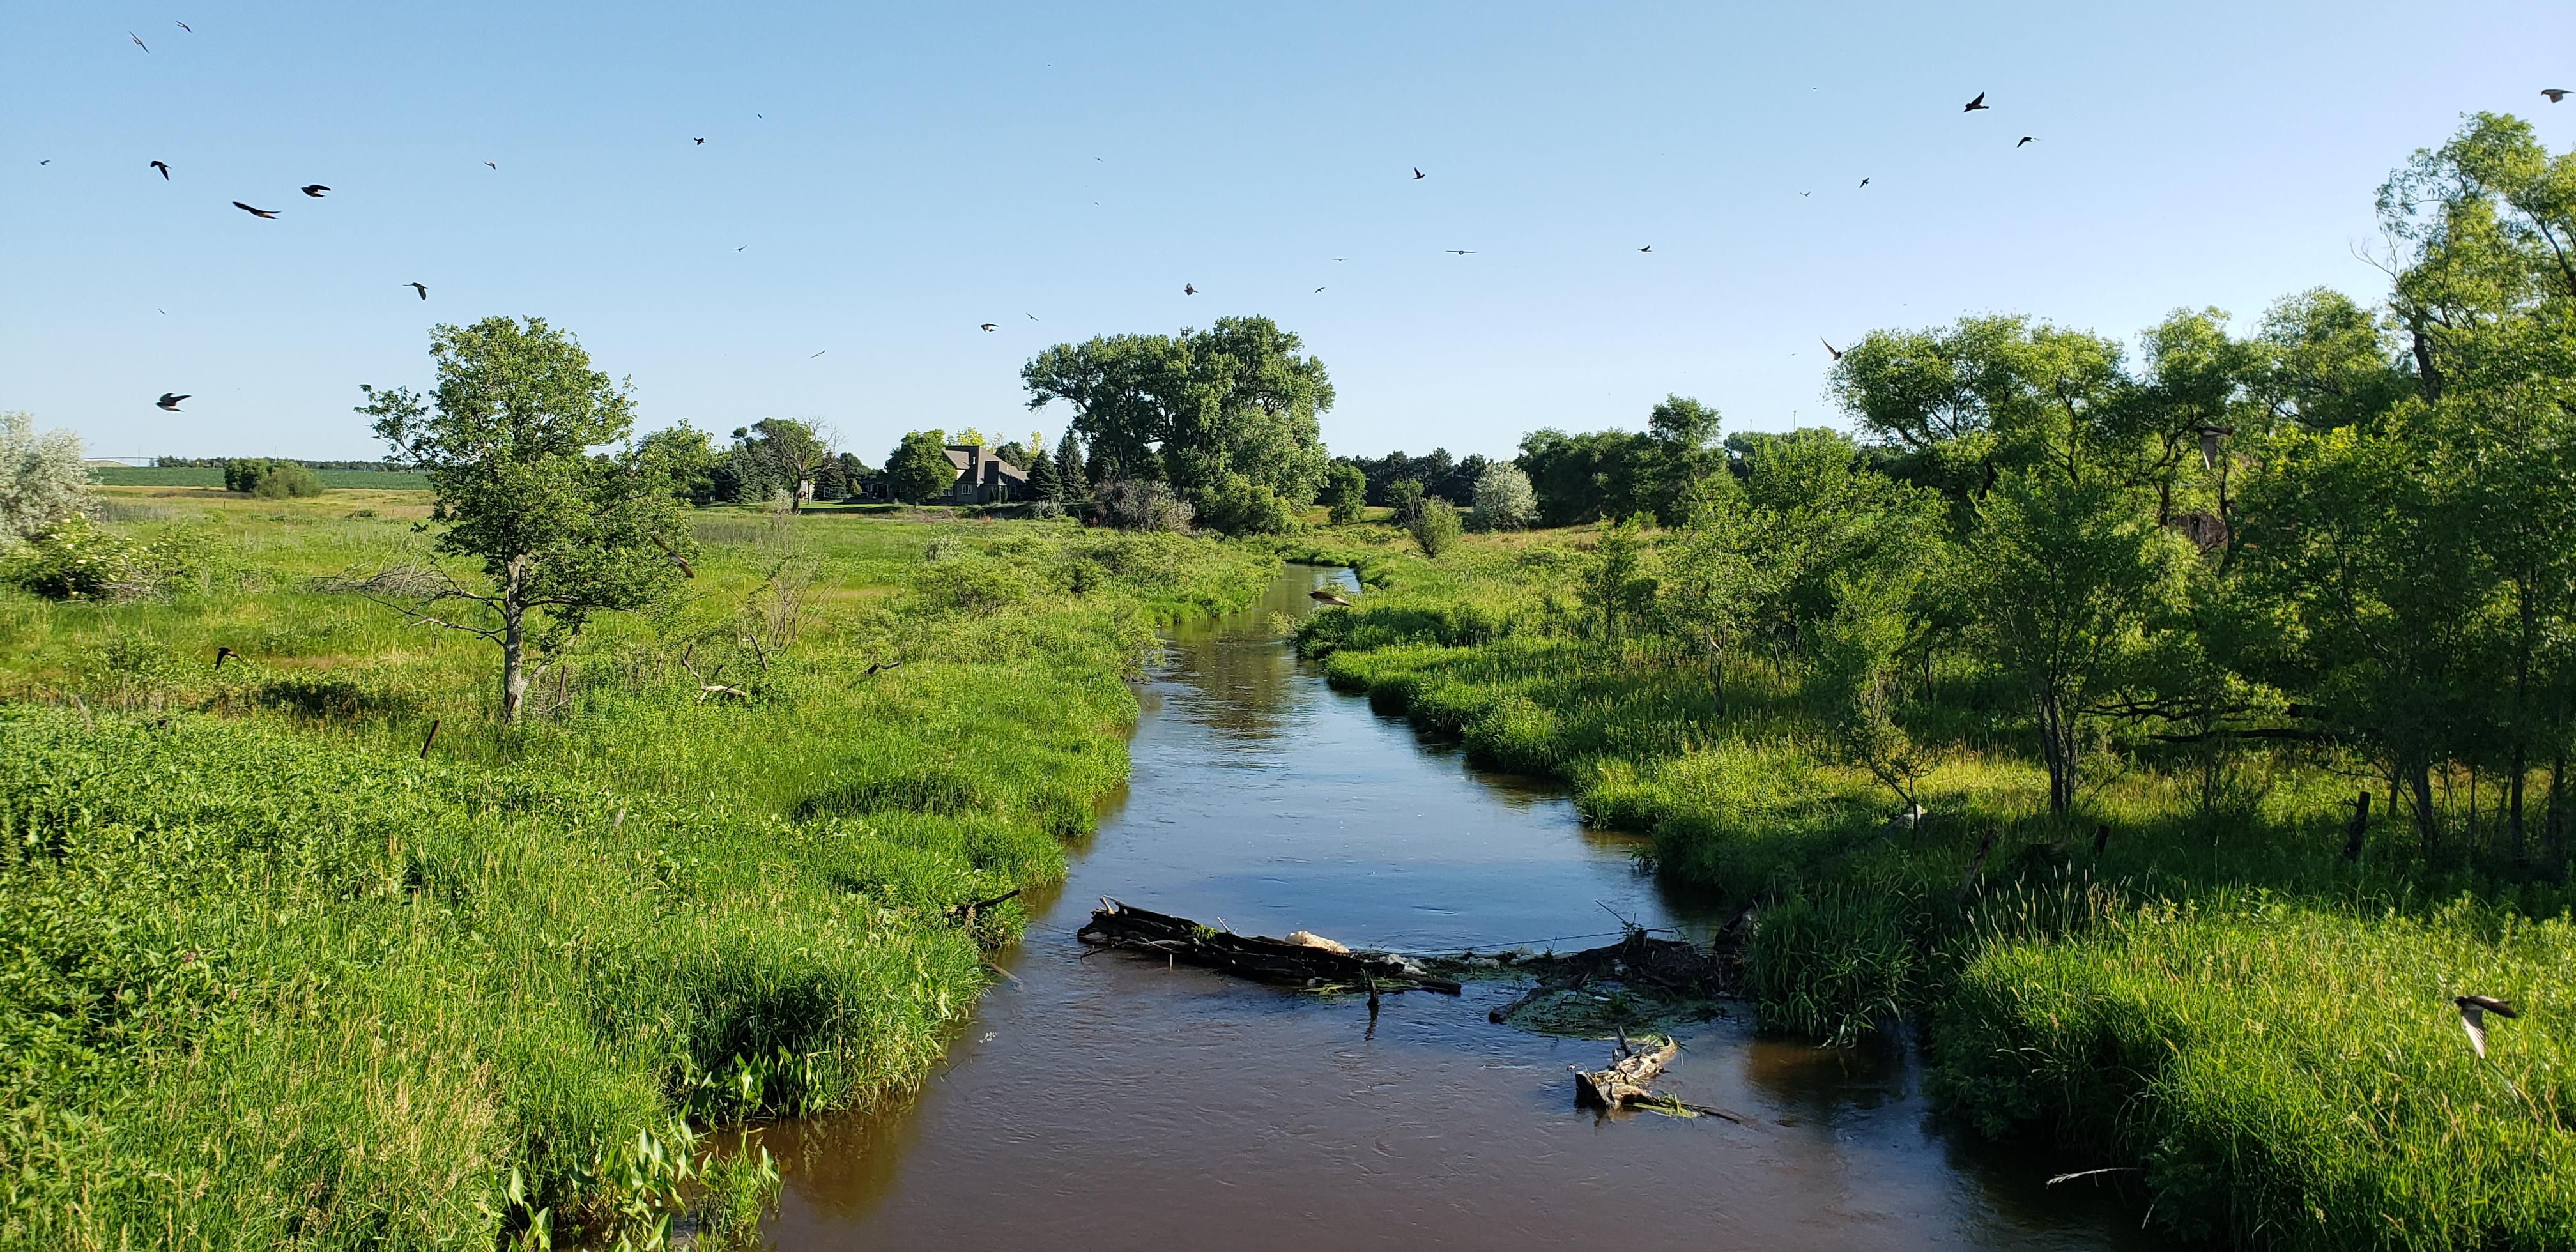
South Loup River at Arnold
Future / Actual / Minor
OWP 2.0 WWA Modal Title
01/11/2021, 10:04 PM UTC through 01/11/2021, 10:04 PM UTC
Sender
Sent
- Upstream gauge unavailableWarning: no valid ratings curve available. Transformations to and from FEET/CFS/KCFS will not happen.
Traces and Thresholds Click to turn on/off display
Observed (OBS) 04/14/2025 6:45 AM CDTCATEGORY STAGE 
Major Flooding 12 ft Moderate Flooding 10 ft Minor Flooding 8 ft Action 8 ft Reliability of the Forecast:
NOTE: Forecasts are not available. Only observed stages are available for this point.
National Water Model Hydrograph
Official NWS streamflow forecasts are produced by NWS hydrologic forecasters for river gauge locations using hydrologic models which are calibrated to that location. This process considers additional guidance and information, including local expertise and experience, to produce the best forecast possible. The NWM output provides supplemental guidance to NWS forecasters and should not be considered an official NWS river forecast.
Flood Impacts
- 12 - Major flood stage. Widespread and significant flooding along the South Loup River. Most of Old Mill Park and the road into Old Mill Park will be flooded. Without protection, homes along the river may begin to experience impacts.
- 10 - Flooding may occur in portions of Old Mill Park closest to the tennis courts.
- 9.5 - Moderate flood stage. Water spreads out significantly along the lower banks. Some flooding is possible on the west side of Arnold, upstream from Old Mill Park. Widespread flooding of agricultural land.
Gauge Info
| Coordinates | 41.4228, -100.203 |
| RFC | MBRFC |
| State | NE |
| WFO | LBF |
| County | Custer |
| Data Provider(s) | |
| US Geological Survey | USGS--Water Resources of the United States |
| USGS | 06781600 |
Gauge Location
Recent Crests
| 1. | 6.05 ft | on 03-06-2023 |
| 2. | 5.89 ft | on 05-02-2022 |
| 3. | 6.37 ft | on 03-20-2021 |
| 4. | 6.68 ft | on 06-09-2020 |
| 5. | 9.92 ft | on 03-13-2019 |
Recent Crests
| 1. | 6.05 ft | on 03-06-2023 |
| 2. | 5.89 ft | on 05-02-2022 |
| 3. | 6.37 ft | on 03-20-2021 |
| 4. | 6.68 ft | on 06-09-2020 |
| 5. | 9.92 ft | on 03-13-2019 |
| 6. | 8.15 ft | on 05-19-2018 |
| 7. | 9.12 ft | on 08-16-2017 |
| 8. | 6.62 ft | on 05-01-2016 |
| 9. | 6.66 ft | on 07-26-2015 |
| 10. | 7.95 ft | on 06-19-2014 |
| 11. | 5.64 ft | on 06-17-2013 |
| 12. | 5.73 ft | on 04-22-2012 |
| 13. | 6.92 ft | on 06-20-2011 |
| 14. | 9.14 ft | on 06-13-2010 |
Historic Crests
| 1. | 9.92 ft | on 03-13-2019 |
| 2. | 9.14 ft | on 06-13-2010 |
| 3. | 9.12 ft | on 08-16-2017 |
| 4. | 8.15 ft | on 05-19-2018 |
| 5. | 7.95 ft | on 06-19-2014 |
Historic Crests
| 1. | 9.92 ft | on 03-13-2019 |
| 2. | 9.14 ft | on 06-13-2010 |
| 3. | 9.12 ft | on 08-16-2017 |
| 4. | 8.15 ft | on 05-19-2018 |
| 5. | 7.95 ft | on 06-19-2014 |
| 6. | 6.92 ft | on 06-20-2011 |
| 7. | 6.68 ft | on 06-09-2020 |
| 8. | 6.66 ft | on 07-26-2015 |
| 9. | 6.62 ft | on 05-01-2016 |
| 10. | 6.37 ft | on 03-20-2021 |
| 11. | 6.05 ft | on 03-06-2023 |
| 12. | 5.89 ft | on 05-02-2022 |
| 13. | 5.73 ft | on 04-22-2012 |
| 14. | 5.64 ft | on 06-17-2013 |
Vertical Datum Table
| type | NAVD88 |
|---|---|
| major Flooding | 2698.19 ft |
| moderate Flooding | 2696.19 ft |
| minor Flooding | 2694.19 ft |
| action | 2694.19 ft |
| Latest Value | 2690.72 ft |
| Gauge Zero | 2686.19 ft |
Horizontal Datum Table
No datum options are available.


Probability Information
No Images Available
Collaborative Agencies
The National Weather Service prepares its forecasts and other services in collaboration with agencies like the US Geological Survey, US Bureau of Reclamation, US Army Corps of Engineers, Natural Resource Conservation Service, National Park Service, ALERT Users Group, Bureau of Indian Affairs, and many state and local emergency managers across the country. For details, please click here.