Weekly Chance of Exceeding Levels Graphic
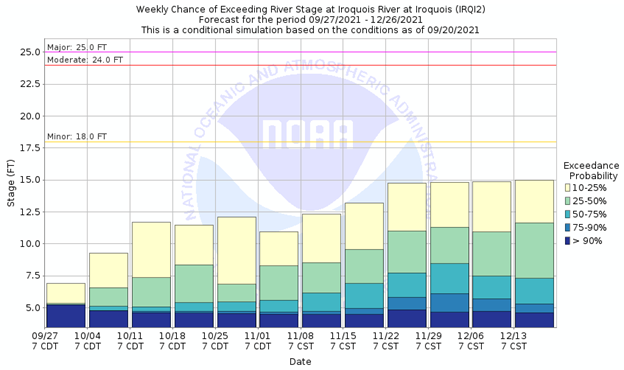
This graphic shows the
probability or chance of the maximum stage, flow, or volume at a point on a
river exceeding a particular value for consecutive 7-day periods in a 90-day
interval. The vertical axis shows river stage or level measured in feet (ft)
and the horizontal axis shows time. An individual multi-color vertical bar represents
the exceedance probabilities for a 7-day period, each color representing a
range of probability as defined in the key to the right of the graph. A sample graphic
is provided below. Click here
to view the most recently
generated Weekly Chance of Exceeding Levels product for the Iroquois River at
Iroquois.